Tag Archives: csun19

Accessibility Sprint – Part 3: Giving non-visual feedback for learning from interacting with PhET simulations

This is the third part of a series of blog posts about a coding sprint about creating interactive online learning that is usable for people with disabilities.

The first post gives an overview of the coding sprint. Each of these subsequent posts describes the work of one team.

Sims Team Goal

Make the University of Colorado Boulder’s well respected, freely available, open-source PhET simulations more accessible for students who cannot see the simulation. By providing just the right amount of aural feedback about what is happening in the simulation after an action taken by a learner, blind and low-vision students could interact with the simulation, hear the results, and try additional actions to understand the underlying physics principles.

For example, PhET has been working on making their Balloon and Static electricity simulation accessible by including scene descriptions that screen readers read aloud in order to orient learners that can’t just look around to see what looks controllable. The controls are all accessible via keyboard actions. But, when a learner takes an action, for instance removing a charged wall that is keeping the balloon steady, the resulting balloon movement must be described. It would overwhelm the listener if small changes are repetitively described, and it can be confusing if messages end up being read out of logical order. For instance, messages about the balloons movement might end up being read behind a message describing its reaching an object and stopping.

Balloon simulation on laptop screen with sweater, balloon, and wall showing. Scene description listed to the right.
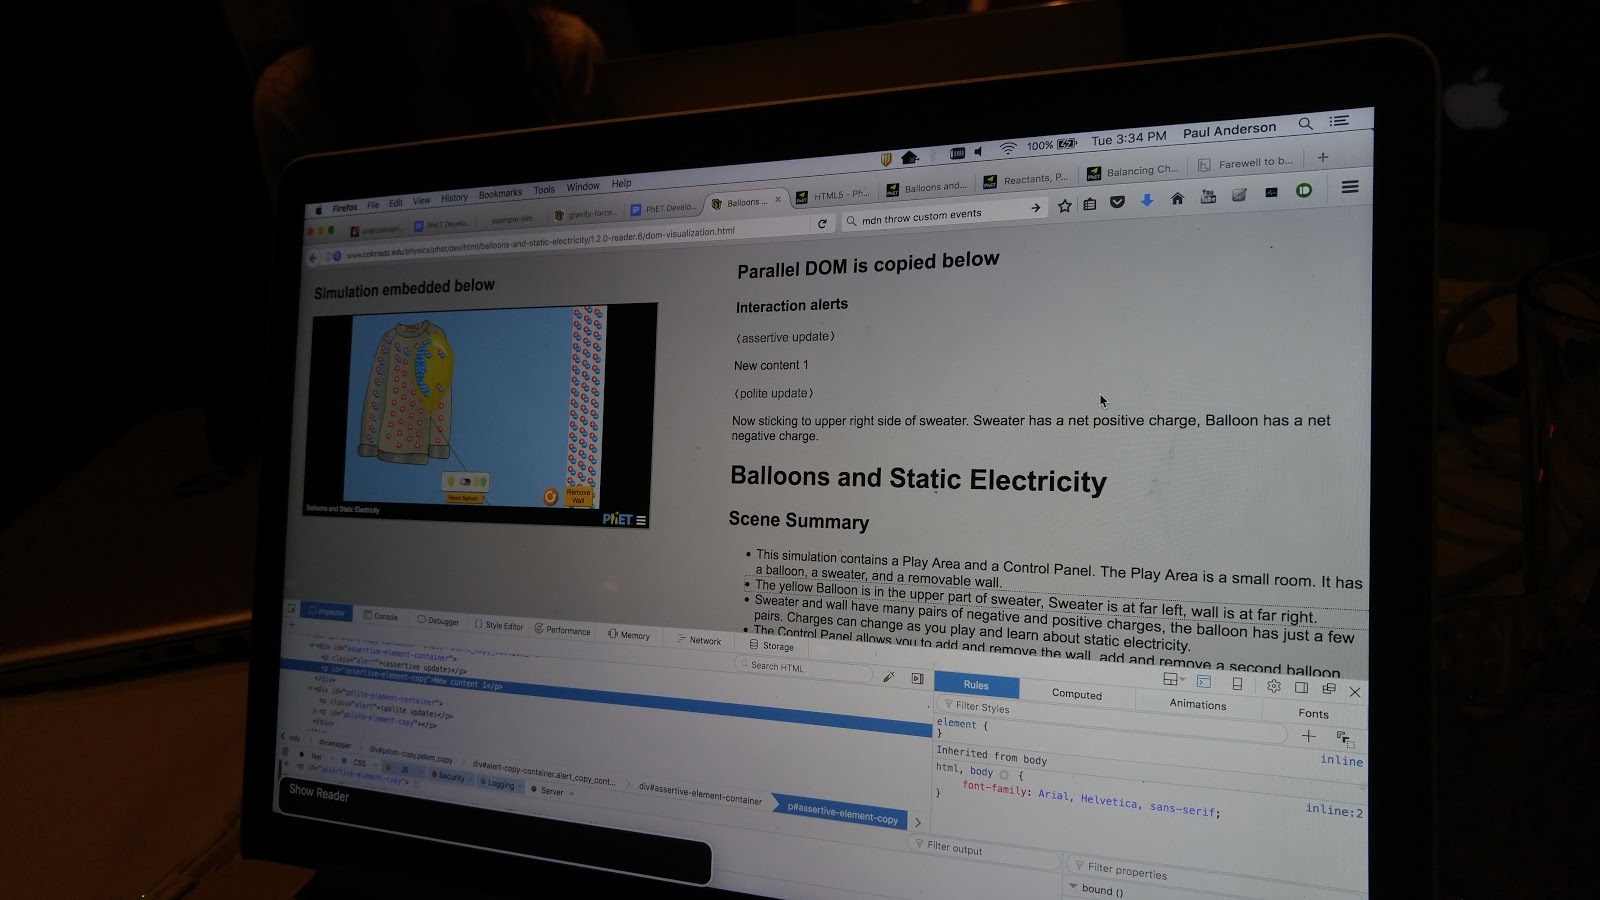
This image shows a balloon simulation of static electricity moving between a shirt and balloon. Beside the visual is information encoded in the DOM that is read when particular actions are taken. This is what will be read using assistive technology to help operate this sim and understand the results when actions are taken.

This group decided to work on extending the messaging being reported by this balloon sim, in order to better report very dynamic events, such as moving the balloon, or the balloon moving itself (attracted to sweater) without overwhelming and overlapping messages. To do this, they designed an UtteranceQueue, which is a FIFO (first in, first out) message queue with certain rules: it takes an object that contains an utterance, an object the utterance is associated with, an expected utterance time (to delay before the next utterance) and a callback that returns a boolean, to allow the utterance to be cancelled, rather than spoken, when it reaches the top of queue. This should allow a simulation programmer to design the set of messages a particular object should report. For example the balloon would report being moved, as well as its state of charge, and whether it is stuck to something. The callback would allow, for example, the balloon movement messages to cancel themselves if the balloon is in fact now stuck to the sweater or wall.

Laptop with balloon sim and code inspector
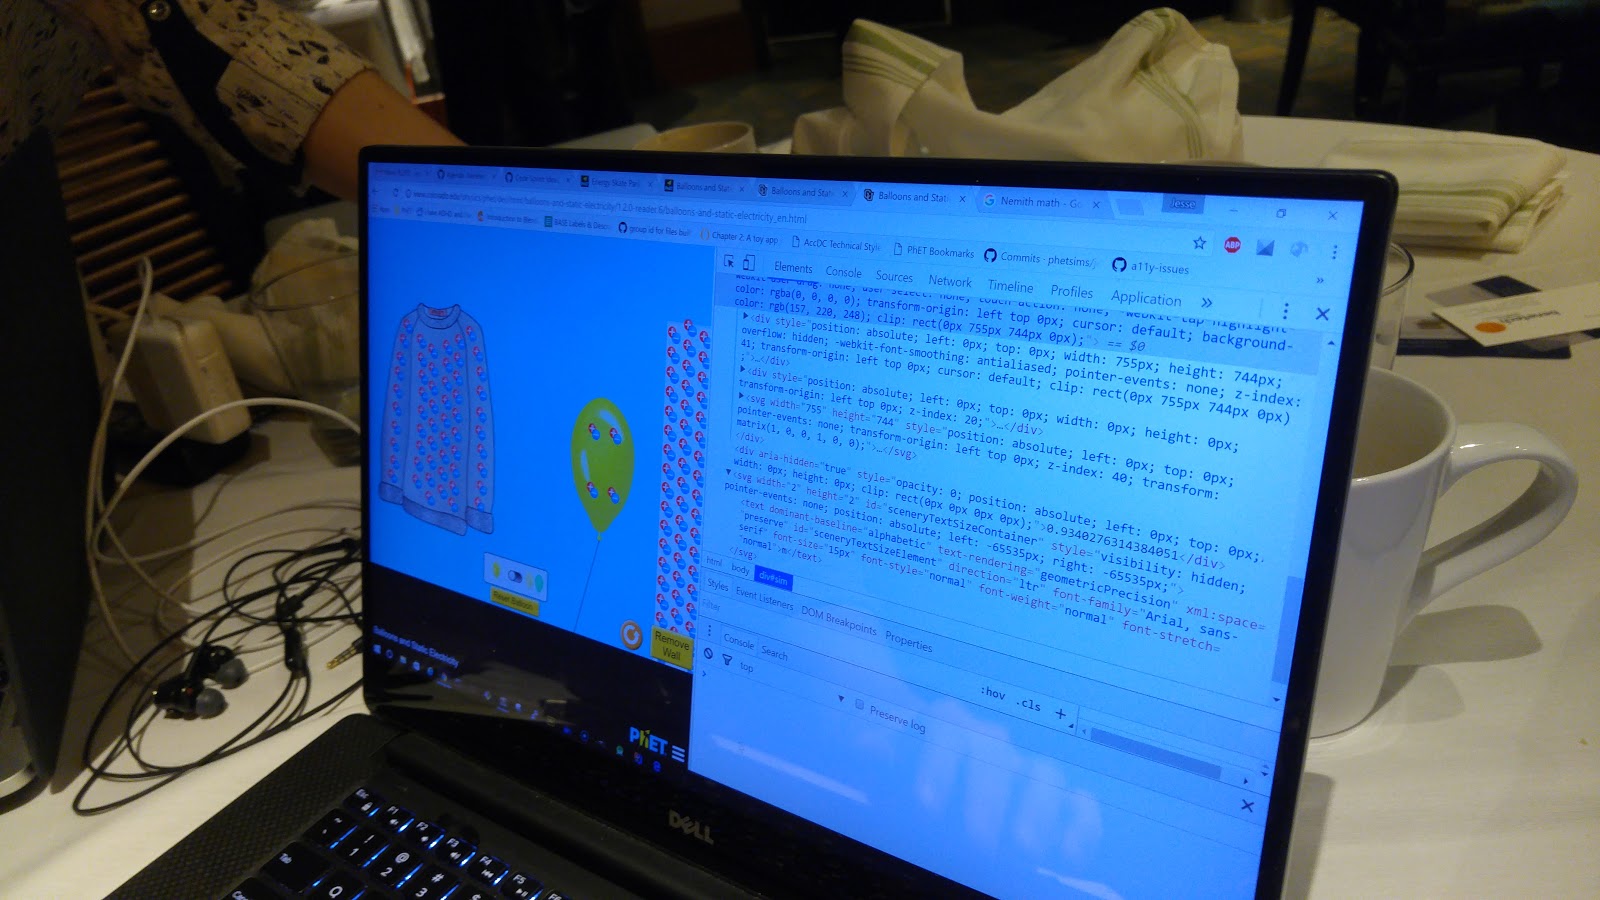
This image is showing the same balloon sim with the browser code view open to see what is controlling the simulation.

Testing (of the earlier version)

While the above development was occurring, one of the team members, Kelly, tested the feedback announcer function in the existing version of the balloon sim (the one before the code sprint) and got some user feedback for the group. The person that she tested with had worked with the sim before, but not with the new scene narration. Her test subject found the narration volubility to be just about right. He did, however, want to have a way to repeat some narration.

Demo

At the end of the day, this group demonstrated the operation of the new UtteranceQueue when the wall is removed and the balloon starts drifting toward the sweater. The movement was described (and not overly repetitive) and when the balloon got to the sweater that event was narrated. No other messages followed.

People who worked in this group: Jesse Greenberg, Darron Guinness, Ross Reedstrom, Kelly Lancaster

Code

https://github.com/phetsims/balloons-and-static-electricity/tree/ocad-hacks

Links

Accessibility sprint – part 2: Creating a mobile-friendly and accessible Infobox for maps

This is the second part of a series of blog posts about a coding sprint that happened the day before CSUN 17. The sprint was about creating interactive online learning that is usable for people with disabilities. This whole software area is called accessibility, and known as inclusive design.

The first post gives an overview of the coding sprint. Each of these subsequent posts describes the work of one team.

Creating a mobile-friendly and accessible Infobox for maps

Team Goal

Create a widget for helping people who are blind or have low vision explore maps that display statistical information (think popular vote winners in the US). This type of map is called a choropleth.

The existing infobox widget takes statistical data in a simple format and works with hot spots on an svg map to bring up an info box as a user mouses over or tabs to different regions on the map. The current version, however, isn’t accessible for low vision, doesn’t work well with screen readers, and doesn’t work on mobile. The team worked on improving these aspects of the widget (which can be reused for any statistical map).

Map of the 2016 US presidential election popular vote results by state, with blue, red, pink and light blue colors for each state. An info box is open for New Mexico with the winner and actual vote totals.
United States 2016 presidential race: Popular vote by state. 

Demo at the end of the day

Doug Schepers demonstrated the improvements. The demo showed the map tool improved for low vision and screen reader access. For low vision, the state selection outline was thickened, the info box contrast was increased and made resizable, the info box placement was adjusted to make sure the selected state was not covered. The ability to select the next state via tabbing on the states was added. Selection is currently in alphabetical order, and a better system would work on the navigation also. He also demonstrated using a screen reader and being able to select a state and hear it read the info box for each state. It uses ARIA Live Regions to update things. The statistical data is formatted using simple name, value pairs.

The ultimate goal is to define a simple standard for describing statistical map data and provide an open-source, reusable, accessible widget for interacting with these maps.

Doug Schepers and Derek Riemer worked together.

The code is available here: https://github.com/benetech/Accessible-Interactives-Dev/tree/master/MapInteractives

CSUN 17 Acessibility Coding Sprint for People with Disabilities (Making learning accessible) – Part 1

Last week, my colleagues at OpenStax, Phil Schatz, Ross Reedstrom and I attended the 2nd annual pre-CSUN (but third overall) accessibility coding sprint to help make learning materials useable by people with disabilities.

Prior accessibility coding sprints

The first took place in 2013 and was jointly sponsored by my Shuttleworth Foundation fellowship and Benetech and held at the offices of SRI. You can read more about that one in these earlier posts (2013-accessibility-post-1, post-2, post-3, post-4, and post-5). The second took place last year before the CSUN 2016 Accessibility Technology Conference in sunny San Diego and was again sponsored by funds from my Shuttleworth Foundation fellowship and by Benetech. That one focused specifically on tools for creating accessible math. Read more in Benetech’s blog post under “Sprinting towards accessible math”, Murray Sargent’s follow up post on accessible trees and Jamie Teh’s post about creating an open-source proof-of-concept extension of math speech rules used by the NVDA browser to make them sound more natural.

This year’s sprint

Four tables with 10 participants conferring and working at laptops
Participants at work

This one again took place in not-quite-as-sunny San Diego (California has been getting lots of rain) before this year’s CSUN-17 conference. The focus was on making interactive learning content accessible. And the very cool thing from my perspective is that my fellowship had nothing to do with the organization of this one. Benetech and MacMillan Learning sponsored and organized this one. The attendance was the largest ever with 30-ish in person participant and 5 or so attending remotely. We had several developers that both create accessible software and use assistive technology themselves.

Like previous sprints, we spent time initially getting to know each other and brainstorming and then divided into multiple teams ranging from a single person to five people working together to prototype, explore, or make progress on a particular accessibility feature. In upcoming posts, I will highlight each of the team’s goals and what they demonstrated at the end of the day.

Upcoming posts (links will be added as subsequent posts appear)

  • Creating responsive (mobile-friendly) and accessible (screen-reader friendly) Infobox for maps
  • Giving non-visual feedback for learning from interacting with PhET simulations
  • Using alternatives to drag and drop for matching, ordering, and categorization tasks
  • Personalizing website interfaces for better accessibility (both sensory and cognitive)
  • Standardizing the display of math in publications
  • A Nemeth and UEB Braille symbols table
  • Using MathJax to produce Braille output from LaTeX math

Read more